How do you choose which KPIs to show?
Ask three questions about every candidate number:
- Who owns it? One person or team responsible for moving it.
- What would we do if it changed? If the answer is “nothing”, drop it.
- How often does it change meaningfully? Daily numbers on a daily screen; quarterly numbers in a monthly review.
Five to eight numbers on the main view is usually plenty. Detail lives one click away.
Which KPIs suit each part of the business?
- Leadership — Revenue vs target, gross margin, cash position, overdue receivables.
- Sales — Pipeline value by stage, win rate, average deal size, new leads by source.
- Operations — Orders shipped on time, backlog, stock below reorder point, returns.
- Finance — Cash flow forecast, days sales outstanding, spend vs budget.
- Marketing — Leads and cost per lead by channel, website conversion rate.
- Customer service — Open tickets, first-response time, repeat customers.
Should you track results or early signals?
Leading indicators
- Show what is likely to happen
- Examples: new leads, quotes sent, website enquiries
- Give you time to act
- Harder to define well
Lagging indicators
- Show what already happened
- Examples: revenue, margin, churn
- Easy to measure and trust
- Too late to change this period
Where should the numbers come from?
A dashboard is only as good as its data. The most reliable dashboards read directly from the systems where work happens — your ERP, store, CRM or accounting — rather than from spreadsheets someone updates by hand. Define each KPI in writing (what counts, which dates, which currency) so two people never get two answers.
- One agreed definition per KPI.
- Automatic data refresh, with the last-updated time visible.
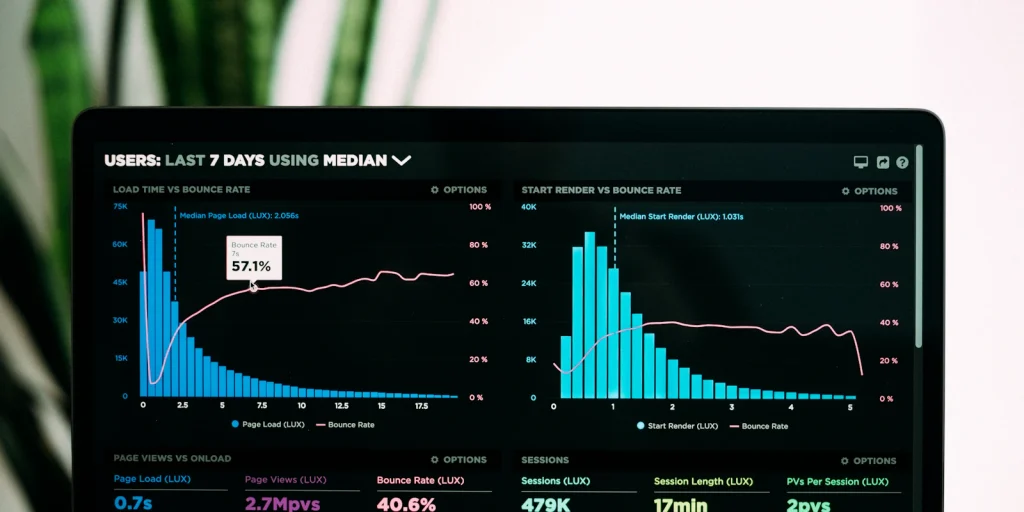
- A target and a trend line next to each number.
Why do dashboards get ignored?
| Mistake | Fix |
|---|---|
| Too many charts on one screen | Five to eight headline numbers, detail behind a click |
| Vanity numbers (page views, followers) | Numbers tied to revenue, cost or customers |
| No targets | Show target and trend beside each KPI |
| Stale or hand-typed data | Connect directly to source systems |
| Nobody reviews it | Put it on the agenda of a regular meeting |
How do you build a first dashboard that people use?
- Start with decisions — List the weekly decisions leaders make, then the numbers each one needs.
- Define each KPI — Write what counts, the source system and the target.
- Check the data — Make sure the source is complete before anyone sees a chart.
- Ship a small version — Five numbers, one screen, reviewed in a real meeting.
- Adjust monthly — Remove numbers nobody uses; add ones people keep asking for.
How should the dashboard look?
Put the most important number top left, show each KPI with its target and direction of travel, and use color only to flag something that needs attention. Make it readable on a laptop and a phone, because managers check numbers on the move. Clear labels and plain units — currency, percent, days — prevent misreading.
Resist adding a chart just because the data exists. Every extra element competes for attention with the numbers that matter, and a calm, sparse screen gets read more often than a crowded one.
Questions we get asked
How many KPIs should a dashboard have?
For the main view, roughly five to eight. Each team can have its own view with a few more.
What is the difference between a metric and a KPI?
A metric is any measurement. A KPI is one of the few metrics you have chosen because it tracks progress toward a goal.
Can Odoo show business dashboards?
Yes. Odoo has built-in reporting views, and its data can also feed a separate dashboard tool when you need to combine several systems.
How often should KPIs be reviewed?
Match the rhythm of the number: operational KPIs daily or weekly, financial and strategic ones monthly or quarterly.
Something else on your mind? Ask us directly →